Cardano (ADA) Detailed Analysis, Forecast, and Price Predictions
Cardano has not been on the most prominent social media radars in 2021, but it has been one of the best-performing cryptocurrency assets of 2021. By market capitalization, Cardano has swapped positions between 3rd and 4th place (excluding stablecoin Tether), behind Bitcoin and Ethereum. Its performance is staggering: +750% YTD. The percentage gains are not due to simple speculation and hype. The largest DCG (Digital Currency Group), Grayscale, has recently created a new ETF specifically for Cardano and includes Cardano in their Grayscale Digital Large Cap Fund. Cardano continues to expand and develop with the most significant development anticipated in late August/early September 2021: the Alonzo release and launch of smart contracts on the Cardano network. The fundamentals remain strong, but it is essential to identify cyclical events and price levels in the future.
Key Cycle Dates – Anniversary Dates
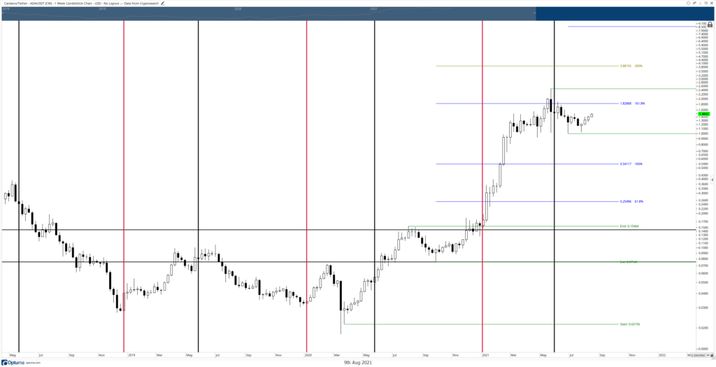
In Gann Analysis, the teachings of W.D. Gann focuses on a great many cycles. One of the most important that Gann identified was the anniversary dates of major highs and lows. He wrote that the date of a major all-time high or all-time low would likely be an important date in the future. The image above shows two series of vertical lines: red and black. The black vertical lines represent the last two weeks of May, which is often a major/minor yearly high or low. I identified this date because of the swing high generated in May 2018 – the first significant relief rally from the sell-off and bear market corrective move. Most recently, the new all-time high was found in May 2020. The following important anniversary date is the beginning of January. I identified the beginning of January as the start because the prior all-time high was formed in early January 2018. January has been at or near major yearly lows in 2019, 20202, and 2021. The current 2021 low is in the first week of January.
(near the end write: January 2022 likely to be a significant high or low and late May 2022 likely to be a major high if January 2022 was a low and a major low if Jan 2022 was a high)
Key Cycle Dates – Cycles of the Inner Year
Gann identified a number of cycles during a 360 – 365 day period. The beginning of an inner year does not always start in January, but almost always at a major high or low. The 2021 low was found on January 2nd, 2021. If we count the days to the new all-time high formed on May 16th, 2021, we get 134-days. 134 is one day away from Gann’s 135-Day Inner Year Cycle. He wrote that the following is likely to occur during a 135-day cycle:
- The last high (or low) can end a topping pattern (or a bottoming pattern if a low).
- If I high was found at 90-days (there was), then 135 is 45-days from a high.
- Always watch for a change in trends.
- Fast moves can start.
The next primary date is the 180 (can extend to 198) day cycle. The most recent major swing low on July 29th, 2021, was 198 days from the 2021 low. So 180-days from the July 29th, 2021 swing low is January 17th, 2022. The 180-day cycle is the second most crucial cycle of the inner year after the 90 (can extend to 99) day cycle. Gann wrote this about the 180-day cycle:
- High probability of trading near support or resistance.
- 180 days up or down often starts a countertrend movement or reverses a trend.
- 180 days from all significant highs and lows must be watched for trend changes.
Beginning with the all-time high (May 16th, 2021), the following dates occur at the specified Inner Year Cycle
90-day cycle: August 14th, 2021
120-day cycle: September 13th, 2021
123-day cycle: September 28th, 2021
144-day cycle: October 7th, 2021
180-day cycle: November 12th, 2021
225-day cycle: December 27th, 2021
250-day cycle: January 21st, 2022
180-days from the July 20th, 2021 swing low is January 17th, 2021
Key Cycles – Minor Gann Time Cycle
In Gann’s cycle analysis, he identified six different minor time cycles: 13-year, 10-year, 7- year, 5-year, 3-year, and 1-year.
January 5th, 2022, is the three-year anniversary of the first major all-time high found on Cardano’s chart.
Along with this cycle is one I’ve discovered for Bitcoin’s cycles I call the 400 and 700-day cycles. Bitcoin’s bullish expansion phases last around 1400 days, while the corrective actions last around 700 days. January 2022 is the end of the 700-day cycle.
Future Price Levels
I want to preface this next section by saying I am a traditional technical analyst. Therefore, while fundamentals do play a role in my overall analysis, fundamentals provide the least amount of weight when it comes to my analysis. That being said, it’s hard to argue with the anticipated increase in Cardano’s valuations when the Alonso upgrade is complete (smart contracts are live on the Cardano network). Cardano will have a massive advantage in the entire cryptocurrency space, and it is anticipated that it will challenge and even surpass Ethereum’s network in both market cap and utilization. It is not easy to quantify those statements, but forward guidance is always cloudy with a chance of sunshine and rain. One fundamental projection that we can undoubtedly anticipate as a certainty is the continued growth of use and money in the cryptocurrency space. And Cardano will continue to be a leader in both market cap and use cases. So what are the price levels of importance in the near future and distant future? How can we determine those values if they have never been traded before? To do that, we look for a combination of natural harmonic price ranges (derived from the same math used in measuring harmonics in the light and sound spectrum), Fibonacci Expansions from significant prior swings, and levels derived from Gann’s Square of 9.
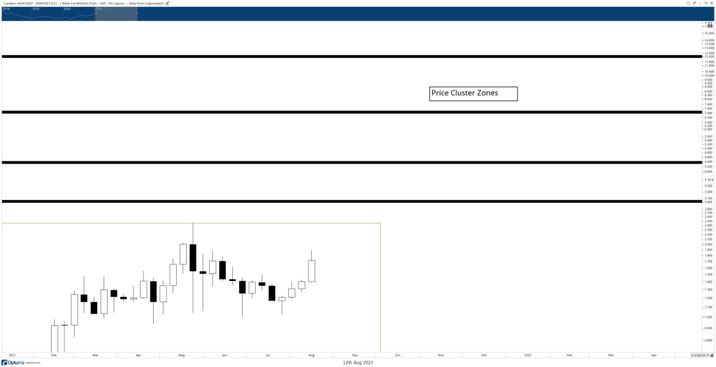
Without going into a significant amount of detail, the price ranges of future importance listed below have at least three price levels derived from Gann’s Square of 9, Harmonic Ratios, and Fibonacci Expansions/Extensions and Fibonacci Confluence zones.
2.43 – 2.46
4.17 – 4.48
6.96 – 7.23
11.08 – 12.03
The following price levels listed below represent major support zones for Cardano.
1.2998 – VPOC (Volume Point Of Control) for 2021.
1.40 – 1.42
0.84 – 0.94
Elliot Wave Structure
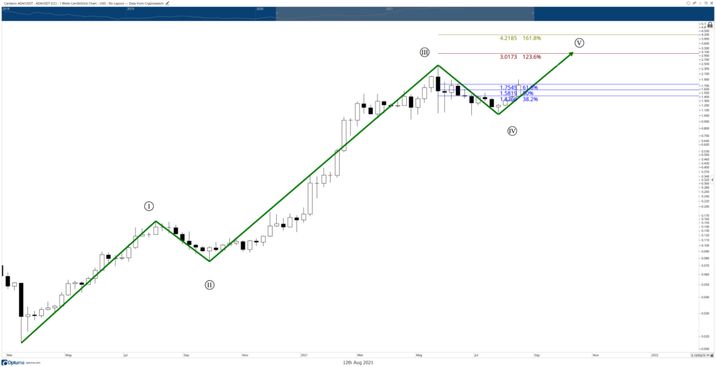
The image above shows the near textbook example of an Elliott Impulse Wave on Cardano’s weekly chart. Waves 1,2,3 and 4 could be considered complete, with the final fifth wave still developing. That is assuming this structure is correct. Wave 5 is typically an inverse Fibonacci Retracement of Wave 4: 123.6% to 161.8%, or it can be equal to Wave 1 or 61.8% of Waves 1 + 3. The 123.6% Fibonacci level of Wave 4 is 3.017, and the 161.8% Fibonacci level is 4.2185. When I’ve reviewed the last swings in this Elliot Impulse Wave, all of the swings match up the appropriate levels – the most important being the 161.8% extension of Wave 1 (1.8149).
Putting it all together
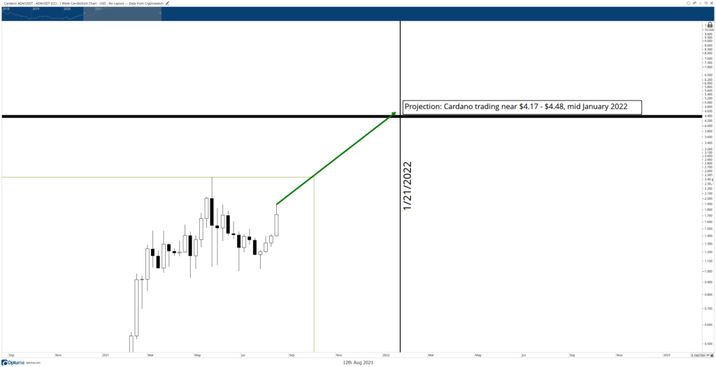
If we assume that the 5th Wave of this Elliot Impulse Wave has yet to complete, we should be able to find a price level where there is a cluster of similar price ranges. For example, the 161.8% extension of Wave 4 at 4.2185 fits perfectly with the cluster of Gann Square of 9, Fibonacci levels, and harmonic ratios that we identified between 4.17 and 4.48. The next step is to identify the date range.
After reviewing the various time cycles, the month of January appears to hold a cluster of cycles:
January 21st: 250-day Gann Inner Year Cycle
January 8th: 3-year Gann Cycle
January 2022: 700-day bull cycle completion
January 17th: 180-day Gann Inner Year Cycle
I anticipate Cardano trading near the $4.17 - $4.48 value area around the middle of January 2022.
If there is a major blow-off top move, I anticipate Cardano trading near the 6.96 – 7.23 value area. This would mean Cardano is trading near a market cap valuation near Ethereum’s market cap.
When we take a close look a the combined analysis for time cycles and price levels, we can get a rough estimate of what price Cardano may trade at and at what time. Of course, some variance must be given as this form of analysis is as much an art as science. Nevertheless, what you should take away from this analysis is a good idea of where and when Cardano could be trading in the future.
Brown method of divergence 2.2885